NEW PIM ANALYZER!
For V2500 update information please read here. To speed up the calculation time of 16 FFT channels for the PIM analysis we are planning to implement CUDA ( standard NVIDIA GPU calculation tools ) in WinRFCalc to improve your PIM analysys.
Introduction
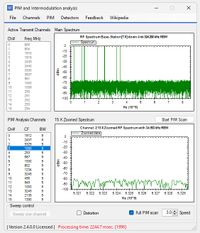
In WinRFCalc version V2400 which will be launched in early 2024, a brand new from the ground up developed optional PIM analyzer will be made available. The main form of the analyzer looks as shown on the right.
The main window of the analyzer shows in the top spectral display the entire frequency range from 0Hz to the Nyquist frequency that is calculated from the sampling rate [Fnyq = Fsample/2].
The fixed frequency span is 0 GHz to 8.5 GHz.
The lower spectral display is a zoom of a portion of the full spectrum above to get more insight in the spectral performance when the non-linear effects are enabled. In this zoomed display, depending on the channel settings, a zoomed span of 9 or 27 MHz can be observed.
The list of zoomed channels is the lower list on the left-hand side.
We have made a YouTube video to show the current status of this development.
Want to have a live TEAMS session demonstration? Please send us a request through the contact form.
Frequency settings
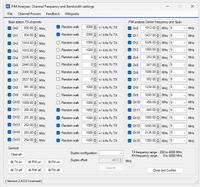
To set how the analyzer is performing the analysis, an extensive frequency settings form is designed as depicted below.
The left side channel list are your TX channels at the base station site. Here you program the center frequency and frequency span of the (UN modulated) channels you which to check on the generation of PIM.
The right-hand channel list show the portions of the spectrum you want to check on PIM. You define the central frequency and span of the portion of the spectrum (SPAN) you want to check. The spans that can be selected are 9 and 27 MHz. These cover all requirements in relation to channel bandwidths.
The random walk setting adds a variation on the TX frequency to simulate modulation of the signal, in case the checkbox for the channel is selected.
All settings in this window can be stored and recalled from the PC file system.
Non-linear factor programming
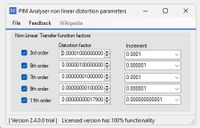
Programming the NON-linear behavior of the analysis can be done with the window shown below. All ODD order parameters can be programmed and are, like all frequency settings, saved on disk.
Analysis
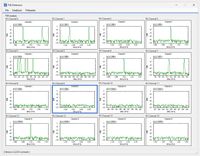
Below, you see the analysis window how it is foreseen in V2400. The sixteen spectral windows you can see are ACTIVE analysis channels as programmed in the frequency settings window.
The following data is foreseen in each analysis window:
- last sweep
- max hold of all past sweeps
- the average of the last 5 sweeps
The picture below shows the last sweep data per channel. When a detector is updated, the border flashes blue.
Below a YouTube movie with an update of the PIM analyzer, dated January 7, 2024.
Do you want to receive a warning when WinRFCalc V2400 is released? Please click here.