WSPR analyser, a brand new WSPR Analysis software for Windows
Want to read the user manual? Click here.
A 27 minute quick introduction of the program
One hour full introduction video going through all the features of the program.
🛰️ What is WSPR?
WSPR (Weak Signal Propagation Reporter) — pronounced “whisper” — is a digital RF mode used by amateur radio operators to measure and analyze how weak radio signals travel across the world. It’s not designed for conversations, but rather to test signal propagation paths using very low transmit power.
ARRL
WSPR uses a narrowband digital protocol that can decode transmissions many thousands of kilometers away, even when the signal is buried in noise. Stations running WSPR exchange information such as call sign, location (grid square), and transmitter power, which is then uploaded to a public database called WSPR.net for analysis.
During Q1 2026, a brand new dedicated software package will be available on this website allowing Ham Radio operators to analyze the WSPR spots they generate worldwide when they are transmitting a WSPR signal from their station.
WSPR (Weak Signal Propagation Reporter) is a perfect method to monitor propagation and in particular the propagation of RF signals from your QTH.
The WSPR reporter database on WSPR.NET can deliver long lists of data in CSV or Excel format, but looking at these lists with a screen full of numbers does not give you a clear picture of the status of the current propagation. The best way to look at the data showing the results of your station compared with a nearby ham radio operator is graphics.
These list can of course be analysed in for example Excel. This disadvantages of Excel, like vulnerable VBA coding and the limitation in the number of rows, do not make Excel an attractive solution.
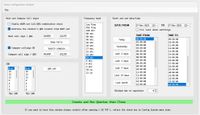
The data is taken directly from the WSPR database by querying according to your own set of parameters in a Query Config window.
📡 Why WSPR Is Useful for RF Operators
Amateur radio enthusiasts and RF engineers use WSPR for several purposes:
• Propagation analysis
See how radio waves move through the atmosphere at different times, bands, and conditions.
• Antenna testing
Compare performance of antennas or setups by seeing how far and how often your signals are reported.
• Station benchmarking
Gauge your transmitter/receiver performance relative to other stations in your area.
Because WSPR signals are extremely weak but still decoded globally, the mode gives a real-world picture of RF propagation.
📊 How WSPR Works
A station transmits a WSPR signal at a scheduled interval. Receiving stations decode the signal and report back data (, location, SNR, etc.).
These reports are sent to the WSPR.net database and can be viewed as real-time maps or lists. The key characteristic of WSPR is its ability to decode signals well below the noise floor, often with signal-to-noise ratios as low as −28 dB. This makes it a powerful way to study propagation, antenna efficiency, and overall station performance
SUMMARY OF THE AVAILABLE CONTROL WINDOWS
For a full explanation of all the capabilities of the software, please download and read the user manual on the download page.
1. Config query window
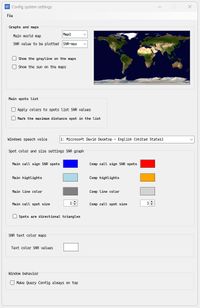
2. Config system window
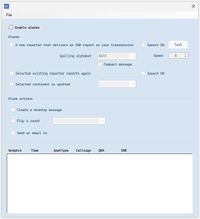
3. Config alarm window
With the spoken alarms (new spots, repeated spots) you do not have to look at your screen all the time, but hear the WSPR activities while you can do your things. This feature is especially handy for operators with visual limitations.
4. Main window
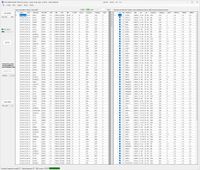
After clicking the large green button in the Config Query window, the data is requested from the database, the Config Query window closes automatically and the main window (that was already open in the background but not filled with data) is displayed with two data grids.
The data grid on the left shows all the WSPR spots received, with the last spots on top of the window. The data grid on the right show all the reporters that have received your transmissions and is sorted alphabetically upwards from 0 (zero) to Z.
After the main window has been filled with the data as requested, the button 'Show Graphs' is activated. Below the button, you see an Up-Down control where you can define a minimum number of spots per reporter as a filter for each reporter shown in the graphical presentations.
5. Graphical data presentations
After the 'Show Graphs' button has been clicked, the graphs window open with a number of tabs where different data presentations can be selected. The followings tabs are available:
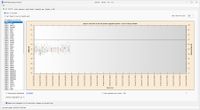
- Received spots as function of time on the X-axis. The Y-axis shows the SNR value of each spot, above the minimum value set in the main window. See the user manual for all the graphical possibilities with the graphing window.
- received spots per reporter plotted on a rectangular equidistant map of the world. The color of the spots is representing the SNR value. The scale and colors are shown on the left from the map, ranging from -40dB to +20dB SNR. The spots are plotted as squares, with the size of the square set by an Up-Down control. Optionally, you can fill the squares,
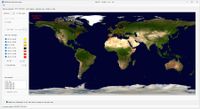
In case a compare station has been defined in the Config Query window, the two call signs indicated as MAIN and COMPARE with the respective call signs, are seen next two round selectors. When the selection is changed with a click of the mouse, the map is redrawn and the data of the selected station presented. An auto toggle checkbox runs this toggle process automatically. The speed of the toggles can be varied with the associated Up-Down control.
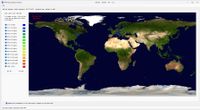
-N spots per reporter. On this map, the number of spots received is indicated by the color of the spot. The color and the corresponding number of spots is shown left of the graph.
6. Azimuthal maps for the Main and Compare stations
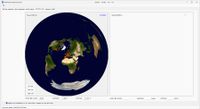
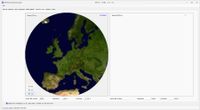
This tab show you two azimuthal maps, with the center of the map the QRA locator of the Main and Compare stations. The big advantage of an azimuthal map over any other rectangular map presentation is that the direction of the spots as seen from your QRA locator are exactly shown on the map.
In the two pictures below, the QRA is modified to EN82BI for K7UV. The lower picture is 50% zoomed.
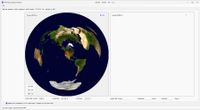
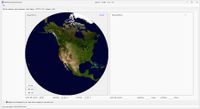
The left map is for the Main station and the right map for the Compare station. The maps are transformed from the selected rectangular equidistant map in the Config System window.
Both maps start with a radius of 20000 km, equaling the distance of half the globe. I.e. on the circle's outer border you are on the opposite side of the earth. With the three zoom shortcuts 0%, 50% and 100% you can make quick zoom selections, with the mouse wheel over the map you can zoom in and out by turning the mouse wheel.
The size of the spots and whether they are filled or not is determined by the settings you can set on the second tab showing the spots on the rectangular map.
Time-lapse video WSPR spots
In this video, you can see how WSPR spots of PA2REH are evolving on 24 December 2025 between 00:00 and 23:59. Read the manual for operational details on this window.
Audio alarm with spoken message when a new spot is received
With the alarm window open and the new reporter option selected, an audio message is spoken announcing the new spot and the details. Recorded on 28 December 2025. WSPR transmissions by PA3AKP on 40m.
Audio alarm with spoken message specified reporter receives your transmission again
When an existing reporter in your spots list spots your signal again, you will receive an audio message.